

Ioneer Ltd

Ioneer Ltd

INR · AU · Basic Materials / Other Industrial Metals & Mining

0.086AUD-0.00 (-2.27%)

Price History

Full chart

Market Stats

Previous Close0.088
Open0.088
Day Range0.084 – 0.089
52-Week Range0.096 – 0.285
Volume11.43M
Market Cap338.21M
P/E (TTM)0.00
Forward P/E0.00
EPS0.00
Dividend Yield0.00%
Beta0.85
50-Day Avg0.1123
200-Day Avg0.1417

About

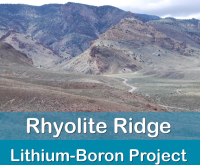
ioneer Ltd operates as a mineral exploration and development company in North America. It engages in the development of the Rhyolite Ridge lithium-boron project located in Nevada, the United States. The company was formerly known as Global Geoscience Limited and changed its name to ioneer Ltd in November 2018. The company was incorporated in 2001 and is based in North Sydney, Australia.

Company Details

  • SectorBasic Materials
  • IndustryOther Industrial Metals & Mining
  • CEOMr. Bernard Anthony Rowe
  • Employees0
  • Headquarters213 Miller Street, North Sydney, NSW, Australia, 2060, Australia
  • Websitehttps://www.ioneer.com

Leadership

  • Mr. James Derrick Calaway BA (Econ), MA (PP&E)Executive Chairman of the Board · b. 1958
  • Mr. Bernard Anthony RoweMD, CEO & Executive Director · b. 1968
  • Ms. April HashimotoInterim Chief Financial Officer · b. 1964
  • Mr. Matt WeaverSenior Vice President of Engineering & Operations · b. 1967
  • Mr. Yoshio NagaiVice President of Commercial Sales & Marketing · b. 1962
  • Mr. Chad YeftichVice President of Corporate Development & External Affairs · b. 1976
  • Mr. Ken CoonVice President of Human Resources · b. 1962
  • Ms. Olga SmejkalovaCompany Secretary

Financials

Income Statement

Currency: USD2006-06-302007-06-302008-06-302009-06-302010-06-302011-06-302012-06-302013-06-302014-06-302015-06-302016-06-302017-06-302018-06-302019-06-302020-06-302021-06-302022-06-302023-06-302024-06-302025-06-302026-06-30
Total Revenue38.00K19.00K151.00K117.00K259.00K773.00K133.00K247.93K90.49K9.81K1.96K89.82K000.0100000-
Growth (%)--50.00%+694.74%-22.52%+121.37%+198.46%-82.79%+86.41%-63.50%-89.15%-80.01%+4477.45%-100.00%---100.00%-----
Cost of Revenue16.00K-257.00K327.00K551.00K447.00K---03.49K1.06K986.357.69K35.34K43.55K165.02K51.34K260.00K277.00K366.34K
Gross Profit-------247.93K90.49K9.81K-1.53K-1.06K-986.35-7.69K-35.34K-43.55K-165.02K-51.34K-260.00K-277.00K-366.34K
Gross Margin-------100.00%100.00%100.00%-77.83%-1.18%---353360000.00%------
Operating Expense-------1.00M-2.34M628.55K473.77K5.58M2.49M3.62M5.72M6.64M11.81M5.92M5.08M6.09M8.67M
Operating Income---398.99K-411.53K-818.54K-2.02M-926.20K-754.31K2.43M-618.74K-475.30K-5.58M-2.50M-3.62M-5.76M-6.69M-11.97M-5.97M-5.34M-6.37M-9.04M
Operating Margin---264.23%-351.74%-316.04%-260.89%-696.39%-304.25%2683.65%-6304.58%-24222.27%-6211.72%---57600630000.00%------
EBITDA---396.22K-510.90K-815.35K-2.00M-897.70K-743.20K2.44M-614.91K-471.80K-5.58M-2.49M-3.62M-5.61M-6.67M-11.80M-9.60M-9.08M-10.04M-8.67M
EBITDA Margin---262.40%-436.67%-314.81%-259.19%-674.96%-299.76%2692.51%-6265.51%-24044.32%-6210.54%---56052450000.00%------
Net Income---589.06K-335.77K-632.85K-744.75K-1.45M-905.86K-4.27M-783.00K-3.55M-5.72M-1.84M-657.80K-3.77M-7.75M-8.50M-6.39M-7.83M-9.55M-8.42M
Net Income Margin---390.11%-286.98%-244.34%-96.35%-1087.69%-365.37%-4716.49%-7978.24%-180924.38%-6367.59%---37735240000.00%------
Interest Expense00190.07K59.26K175.07K1.27M520.42K151.55K0005.88K04.89K19.40K24.02K16.50K15.80K2.00K2.00K66.23K
Interest Expense % of Total Revenue0.00%0.00%125.87%50.65%67.60%164.55%391.30%61.13%0.00%0.00%0.00%6.55%--194010000.00%------

Balance Sheet

Currency: USD2006-06-302007-06-302008-06-302009-06-302010-06-302011-06-302012-06-302013-06-302014-06-302015-06-302016-06-302017-06-302018-06-302019-06-302020-06-302021-06-302022-06-302023-06-302024-06-302025-06-302026-06-30
Total Assets77.00K3.05M3.75M2.27M3.39M9.24M8.29M6.12M3.45M1.95M435.92K9.55M70.34M68.88M92.72M148.95M212.62M205.84M224.47M233.54M232.70M
Total Liabilities95.00K154.00K96.19K12.29K103.80K154.73K321.97K67.27K60.13K14.72K275.68K172.88K1.05M2.02M2.61M5.51M9.52M8.90M6.25M3.24M2.33M
Total Equity-3.05M3.66M2.26M3.29M9.08M7.97M6.05M3.39M1.94M160.24K9.38M69.30M66.87M90.11M143.44M203.10M196.94M218.22M230.30M230.37M
Cash11.00K2.43M2.44M710.46K871.05K1.69M790.28K584.18K260.54K26.43K267.11K5.67M59.28M33.98M26.52M62.37M93.90M52.59M35.72M25.06M17.88M
Total Debt----------99.25K--228.81K270.04K267.45K293.08K211.69K1.28M373.00K335.23K
Net Debt--2.43M-2.44M-710.46K-871.05K-1.69M-790.28K-584.18K-260.54K-26.43K-167.86K-5.67M-59.28M-33.98M-26.29M-62.13M-93.65M-52.37M-34.43M-24.69M-17.54M

Cash Flow

Currency: USD2007-06-302008-06-302009-06-302010-06-302011-06-302012-06-302013-06-302014-06-302015-06-302016-06-302017-06-302018-06-302019-06-302020-06-302021-06-302022-06-302023-06-302024-06-302025-06-302026-06-30
Operating Cash Flow--217.09K-248.37K-241.26K-354.18K-220.02K-352.49K-526.29K-213.55K-294.48K-1.36M-1.35M-2.25M-4.18M-4.84M-9.35M-8.07M-7.20M-6.80M-2.86M
Investing Cash Flow5.00K-820.05K-801.65K-1.05M-3.62M-1.70M-201.30K-1.07M-289.85K-428.50K-2.27M-5.18M-22.45M-31.25M-17.78M-25.02M-32.47M-35.38M-13.83M-6.87M
Financing Cash Flow167.00K3.42M-1.34M4.30M1.19M463.32K1.21M308.26K956.28K9.03M60.36M393.56K26.80M57.34M75.39M-225.00K25.49M10.20M2.05M
Capital Expenditure024.40K11.26K2.16K71.81K1.66M2.56K1.12K377.90K442.77K2.29M5.18M22.45M31.25M17.78M25.02M33.50M36.64M14.51M9.31K
Free Cash Flow--241.49K-259.63K-243.42K-425.99K-1.88M-355.06K-527.41K-591.45K-737.25K-3.65M-6.53M-24.69M-35.43M-22.62M-35.35M-40.03M-43.84M-6.80M-2.87M
Dividends Paid---------00---156.84K-----
FCF to OCF-111.24%104.54%100.90%120.28%855.68%100.73%100.21%276.96%250.36%267.82%483.24%1099.41%848.44%467.29%378.29%496.04%608.99%100.00%100.33%
Dividend Paid to FCF---------0.00%0.00%----0.69%-----

Earnings

Report DateFeb 23, 2016Sep 30, 2016Feb 3, 2017Aug 28, 2017Feb 28, 2018Sep 27, 2018Mar 1, 2019Sep 17, 2019Feb 26, 2020Sep 16, 2020Dec 2, 2020Mar 9, 2021Jun 2, 2021Sep 15, 2021Dec 1, 2021Feb 23, 2022Jun 1, 2022Sep 20, 2022Nov 30, 2022Feb 26, 2023May 31, 2023Sep 20, 2023Nov 29, 2023Feb 20, 2024May 29, 2024Sep 17, 2024Nov 27, 2024Feb 18, 2025May 28, 2025Sep 16, 2025Dec 3, 2025Feb 18, 2027
EPS Estimate0.000.000.000.000.000.000.000.000.000.000.000.000.000.000.000.000.000.000.000.000.000.000.000.000.000.000.000.000.000.000.00-
EPS Actual0.000.000.00-0.010.000.000.000.000.000.000.000.000.000.000.000.000.000.000.000.000.000.000.000.000.000.000.000.000.000.000.00-
Surprise--------------------------------
Timing--------------------------------

Key Statistics & Ratios

Market Cap338.21M
Enterprise Value328.94M
Trailing P/E0.00
Forward P/E0.00
Price / Sales515.56
Price / Book1.09
EPS0.00
Book Value0.128
Revenue (TTM)656.00K
Gross Profit (TTM)656.00K
EBITDA-7.86M
Profit Margin0.00%
Operating Margin-608.41%
Return on Equity-398.77%
Return on Assets-2.78%
Shares Outstanding3.07B
Shares Float2.46B
Beta0.85
Dividend Yield0.00%
Dividend Rate0.00
Payout Ratio0.00%

Ownership Breakdown

Institutions
11.18%
Insiders
25.15%
Retail / Other
63.67%

Top Fund Holders

  • Global X Fds-Global X Lithium & Battery Tech ETF
    27.99M1.48%
  • DFA Asia Pacific Small Company Series
    330.19K0.02%
  • DFA International Sustainability Core 1 Portfolio
    197.32K0.01%

Stock Splits

  • Oct 3, 201418:17
  • May 16, 2013205:194
  • Oct 25, 201018:17
  • Aug 6, 2009148:109