

Jungheinrich AG Pfd.
0EXP · LSE
Price History
Full chartMarket Stats
About
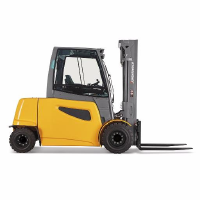
Jungheinrich Aktiengesellschaft, through its subsidiaries, provides products and solutions for the intralogistics sector with a portfolio of material handling equipment, automated systems, and warehouse equipment and services worldwide. It operates in two segments, Intralogistics and Financial Services. The Intralogistics segment engages in the development, production, sale, and short-term rental of new material handling equipment and warehousing equipment products, including automation; sale and short-term leasing of used trucks; and provision of spare parts, as well as maintenance and repair services. The Financial Services segment is involved in sales financing and usage transfer of material handling and warehousing equipment. Its products include electric and hand pallet trucks, and electric pallet stackers; order pickers; reach trucks; very narrow aisle trucks and EKX cold store high rack stackers; electric forklifts; and tow tractors, tugger train trailers, shuttles, used forklift trucks, and assistance systems. The company also offers rental fleet, and battery and charger rental solutions; contract and event hire services; full flex rental services; automated guided vehicles, conveyor technology, and stacker cranes; lithium-ion and lead-acid batteries; charging technology; powertrain solutions; electric drives/drivetrains; controllers; electromechanics components, control pedals, and displays; electric mounting panels; and cable sets. In addition, it provides warehouse racking and storage services; digital products and software solutions, including warehouse, fleet, and interface management systems; energy solutions; PowerCube; mobile robots; forklift trucks; explosion proof forklifts; and industrial IT solutions, such as WiFi-infrastructure, barcode-scanner, and mobile workstation, as well as develops software. It distributes its products through its direct sales and service network. The company was founded in 1953 and is headquartered in Hamburg, Germany.
Company Details
- CEODr. Lars Brzoska
- Employees20.90K
- HeadquartersFriedrich-Ebert-Damm 129, Hamburg, Germany, 22047, UK
- Websitehttps://www.jungheinrich.com
Leadership
- Dr. Lars BrzoskaChairman of the Board of Management & Corporate Labor Director · b. 1972
- Ms. Nadine DespineuxMember of the Board of Management of Sales · b. 1978
- Maik MantheyMember of the Board of Management of Technics · b. 1975
- Dr. Tobias HarzerMember of the Board of Management of Automation & Warehouse Equipment · b. 1974
- Ms. Andrea BleesenHead of Investor Relations
- Mr. Thomas HeynExecutive Human Resources Director
- Dr. Stefan SeemüllerHead of Project Sales
Financials
Income Statement
Balance Sheet
Cash Flow
Earnings
Key Statistics & Ratios
Dividends
Stock Splits
- Jun 22, 2016959692:319897