

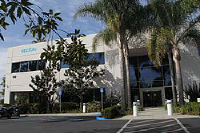
Appfolio Inc

Appfolio Inc

APPF · NASDAQ · Technology / Software - Application

224.34USD+1.54 (+0.69%)

Price History

Full chart

Market Stats

Previous Close222.80
Open225.13
Day Range222.02 – 227.39
52-Week Range142.56 – 283.14
Volume186.25K
Market Cap7.24B
P/E (TTM)46.57
Forward P/E128.21
EPS4.39
Dividend Yield0.00%
Beta0.85
50-Day Avg202.46
200-Day Avg186.78

About

AppFolio, Inc., together with its subsidiaries, provides cloud-based platform for the real estate industry in the United States. The company provides a cloud-based platform that assist with accounting, reporting, marketing, leasing, maintenance, workflow automation, and communication services. It offers AppFolio Property Manager Core, a platform that provides the accounting functionalities for small property management companies, as well as serves as a system of record; AppFolio Property Manager Plus, which offers affordable housing and student housing, advanced accounting, advanced data analysis, and read-only API access services; and AppFolio Property Manager Max that provides customer relationship management tools and full database access through a read and write application programming interface services. The company also provides value-added services, such as electronic payment, tenant screening, maintenance, business optimization, resident, and risk mitigation services. It serves property managers, property investors, potential residents, residents, and vendors. AppFolio, Inc. was incorporated in 2006 and is headquartered in Santa Barbara, California.

Company Details

  • SectorTechnology
  • IndustrySoftware - Application
  • CEOMr. Shane Trigg
  • Employees1.70K
  • Headquarters70 Castilian Drive, Santa Barbara, CA, United States, 93117, USA
  • Websitehttps://www.appfolio.com

Leadership

  • Mr. Shane TriggPresident, CEO & Chairman · b. 1976
  • Mr. Timothy Mathias EatonCFO & Interim Principal Accounting Officer · b. 1989
  • Mr. Evan PickeringSenior VP, General Counsel & Corporate Secretary · b. 1981
  • Ms. Elizabeth BaratChief People Officer · b. 1976
  • Mr. Matthew BairdChief Technology Officer
  • Ms. Lisa HornerChief Marketing Officer
  • Ms. Maryclaire CampbellChief Revenue Officer · b. 1959
  • Mr. Kyle TriplettChief Product Officer
  • Mr. Steven BiringerSenior Vice President of Growth Strategy & Development
  • Bill SchroederVice President of Finance

Financials

Income Statement

Currency: USD2013-12-312014-12-312015-12-312016-12-312017-12-312018-12-312019-12-312020-12-312021-12-312022-12-312023-12-312024-12-312025-12-31
Total Revenue26.54M47.67M74.98M105.59M143.80M190.07M256.01M310.06M359.37M471.88M620.45M794.20M950.82M
Growth (%)-+79.61%+57.28%+40.82%+36.20%+32.17%+34.69%+21.11%+15.90%+31.31%+31.48%+28.01%+19.72%
Cost of Revenue13.62M22.55M33.90M44.63M55.28M73.55M101.64M119.03M143.94M191.83M238.08M301.61M367.99M
Gross Profit12.93M25.12M41.07M60.96M88.52M116.52M154.37M191.03M215.43M280.06M382.37M492.59M582.83M
Gross Margin48.70%52.69%54.78%57.73%61.56%61.30%60.30%61.61%59.95%59.35%61.63%62.02%61.30%
Operating Expense20.53M33.67M56.08M69.38M79.19M96.87M147.91M181.24M227.30M352.43M381.41M356.95M429.91M
Operating Income-7.60M-8.56M-15.00M-8.42M9.34M19.66M6.46M9.78M-11.88M-72.37M963.00K135.64M152.92M
Operating Margin-28.65%-17.95%-20.01%-7.98%6.49%10.34%2.52%3.16%-3.31%-15.34%0.16%17.08%16.08%
EBITDA-4.46M-4.82M-8.89M1.51M22.03M34.23M33.00M229.17M35.78M-30.41M36.63M169.87M183.76M
EBITDA Margin-16.78%-10.10%-11.86%1.43%15.32%18.01%12.89%73.91%9.96%-6.44%5.90%21.39%19.33%
Net Income-7.30M-8.62M-15.67M-8.28M9.72M19.97M36.28M158.40M1.03M-68.12M2.70M204.07M140.92M
Net Income Margin-27.52%-18.08%-20.90%-7.84%6.76%10.51%14.17%51.09%0.29%-14.44%0.44%25.69%14.82%
R&D5.06M6.50M9.55M12.64M16.58M24.11M39.51M48.53M65.98M111.12M151.36M160.38M190.42M
R&D as % of Total Revenue19.05%13.65%12.74%11.97%11.53%12.69%15.43%15.65%18.36%23.55%24.40%20.19%20.03%
Interest Expense00595.00K246.00K535.00K01.65M1.85M501.00K1.18M---
Interest Expense % of Total Revenue0.00%0.00%0.79%0.23%0.37%0.00%0.65%0.60%0.14%0.25%---

Balance Sheet

Currency: USD2012-12-312013-12-312014-12-312015-12-312016-12-312017-12-312018-12-312019-12-312020-12-312021-12-312022-12-312023-12-312024-12-312025-12-31
Total Assets-27.71M25.43M90.48M92.58M110.25M175.74M260.10M389.48M408.02M381.22M408.89M626.68M722.27M
Total Liabilities-71.67M76.90M17.78M22.90M25.17M83.89M128.15M103.56M110.64M115.67M111.58M107.39M179.69M
Total Equity--43.96M-51.47M72.70M69.68M85.08M91.85M131.95M285.92M297.38M265.55M297.31M519.29M542.58M
Cash-11.27M5.41M12.06M10.70M16.11M74.08M15.81M140.26M57.85M70.77M49.51M42.75M107.22M
Total Debt------49.81M84.72M41.99M57.61M53.59M44.74M41.75M71.45M
Net Debt--11.27M-5.41M-12.06M-10.70M-16.11M-24.26M68.91M-98.27M-240.00K-17.18M-4.77M-1.00M-35.77M

Cash Flow

Currency: USD2013-12-312014-12-312015-12-312016-12-312017-12-312018-12-312019-12-312020-12-312021-12-312022-12-312023-12-312024-12-312025-12-31
Operating Cash Flow-4.37M475.00K-6.84M11.50M29.37M36.27M38.89M48.30M35.39M25.36M60.28M188.16M242.10M
Investing Cash Flow-265.00K-6.48M-59.37M-13.06M-22.83M-4.64M-89.87M146.51M-110.46M-6.47M-55.58M-151.76M10.24M
Financing Cash Flow11.96M144.00K72.86M201.00K-1.13M26.35M-7.27M-70.36M-7.35M-6.16M-25.96M-43.40M-187.89M
Capital Expenditure3.69M6.48M11.39M15.41M12.67M14.41M29.08M45.08M32.72M6.54M13.87M2.02M3.15M
Free Cash Flow-8.06M-6.00M-18.23M-3.91M16.70M21.86M9.80M3.22M2.67M18.82M46.42M186.14M238.95M
Dividends Paid--000-5.60M11.37M-----
FCF to OCF184.39%-1263.37%266.39%-34.00%56.87%60.28%25.21%6.66%7.55%74.22%77.00%98.93%98.70%
Dividend Paid to FCF--0.00%0.00%0.00%-57.13%353.34%-----

Earnings

Report DateAug 6, 2015Nov 9, 2015Feb 22, 2016May 9, 2016Aug 8, 2016Nov 7, 2016Feb 27, 2017May 5, 2017Aug 7, 2017Nov 6, 2017Feb 26, 2018Apr 30, 2018Jul 30, 2018Oct 29, 2018Feb 28, 2019May 2, 2019Jul 29, 2019Oct 28, 2019Mar 2, 2020May 4, 2020Aug 3, 2020Nov 9, 2020Mar 1, 2021May 10, 2021Aug 8, 2021Nov 8, 2021Feb 28, 2022May 9, 2022Jul 28, 2022Oct 27, 2022Jan 26, 2023Apr 27, 2023Jul 27, 2023Oct 26, 2023Jan 25, 2024Apr 25, 2024Jul 25, 2024Oct 24, 2024Jan 30, 2025Apr 24, 2025Jul 31, 2025Oct 30, 2025Jan 29, 2026Apr 23, 2026Jul 23, 2026Oct 29, 2026
EPS Estimate-0.43-0.17-0.15-0.09-0.09-0.07-0.07-0.040.040.060.090.120.190.220.140.180.170.170.120.060.150.260.070.110.200.16-0.02-0.01-0.08-0.13-0.13-0.050.130.420.680.890.961.030.941.221.281.451.251.471.241.33
EPS Actual-0.36-0.13-0.10-0.09-0.07-0.030.010.050.130.150.120.160.250.200.070.150.100.170.050.060.623.95-0.010.090.150.11-0.04-0.200.030.11-0.05-0.010.240.590.881.051.141.290.921.211.391.311.391.611.23-
Surprise16.28%23.53%33.33%0.00%22.22%57.14%114.29%225.00%225.00%150.00%33.33%33.33%31.58%-9.09%-50.00%-16.67%-41.18%0.00%-58.33%0.00%313.33%1419.23%-114.29%-18.18%-25.00%-31.25%-100.00%-1900.00%137.50%184.62%61.54%80.00%84.62%40.48%29.41%17.98%18.75%25.24%-2.13%-0.82%8.59%-9.66%11.20%9.52%-0.81%-
TimingAfter-hoursAfter-hoursAfter-hoursAfter-hoursAfter-hoursAfter-hoursAfter-hoursAfter-hoursAfter-hoursAfter-hoursAfter-hoursAfter-hoursAfter-hoursAfter-hoursAfter-hoursAfter-hoursAfter-hoursAfter-hoursAfter-hoursAfter-hoursAfter-hoursAfter-hoursAfter-hoursAfter-hoursAfter-hoursAfter-hoursAfter-hoursAfter-hoursAfter-hoursAfter-hoursAfter-hoursAfter-hoursAfter-hoursAfter-hoursAfter-hoursAfter-hoursAfter-hoursAfter-hoursAfter-hoursAfter-hoursAfter-hoursAfter-hoursAfter-hoursAfter-hoursAfter-hoursAfter-hours

Key Statistics & Ratios

Market Cap7.24B
Enterprise Value7.60B
Trailing P/E46.57
Forward P/E128.21
PEG Ratio7.45
Price / Sales6.96
Price / Book13.83
EPS4.39
Book Value14.86
Revenue (TTM)1.04B
Gross Profit (TTM)661.30M
EBITDA194.70M
Profit Margin15.13%
Operating Margin18.85%
Return on Equity32.09%
Return on Assets18.75%
Shares Outstanding24.09M
Shares Float23.19M
Beta0.85
Dividend Yield0.00%
Dividend Rate0.00
Payout Ratio0.00%

Analyst Ratings

Buy
Based on 8 analystsTarget 234.16
  • Strong Buy
    3
  • Buy
    2
  • Hold
    2
  • Sell
    1

Ownership Breakdown

Institutions
99.44%
Insiders
3.95%
Retail / Other
0.00%

Top Institutional Holders

  • BlackRock Inc
    2.55M7.19%
  • Principal Financial Group Inc
    1.61M4.53%
  • Vanguard Portfolio Management, LLC
    1.49M4.19%
  • Vanguard Capital Management, LLC
    1.05M2.96%
  • Ashe Capital Management, LLC
    1.05M2.96%
  • William Blair Investment Management, LLC
    721.83K2.04%
  • State Street Corp
    721.66K2.04%
  • Nellore Capital Management LLC
    654.87K1.85%
  • T. Rowe Price Associates, Inc.
    513.44K1.45%
  • Geode Capital Management, LLC
    506.29K1.43%
  • Kayne Anderson Rudnick Investment Management LLC
    454.46K1.28%
  • Lead Edge Capital Management, LLC
    399.66K1.13%
  • Arrowstreet Capital Limited Partnership
    384.53K1.09%
  • Jacobs Levy Equity Management, Inc.
    367.13K1.04%

Top Fund Holders

  • Principal MidCap R5
    1.05M2.96%
  • iShares Core S&P Mid-Cap ETF
    840.74K2.37%
  • Vanguard MStar Total Stk Mkt Idx Invest
    725.77K2.05%
  • Touchstone Mid Cap Y
    634.54K1.79%
  • Vanguard Small Cap Index
    525.43K1.48%
  • Vanguard Information Technology ETF
    475.29K1.34%