

China Railway Construction Heavy Industry Corp Ltd

China Railway Construction Heavy Industry Corp Ltd

688425 · SHG · Industrials / Specialty Industrial Machinery

3.93CNY-0.03 (-0.76%)

Price History

Full chart

Market Stats

Previous Close3.96
Open3.96
Day Range3.92 – 3.97
52-Week Range3.85 – 5.81
Volume11.98M
Market Cap21.07B
P/E (TTM)17.17
Forward P/E0.00
EPS0.23
Dividend Yield2.13%
Beta0.17
50-Day Avg4.08
200-Day Avg4.65

About

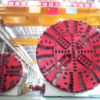
China Railway Construction Heavy Industry Corporation Limited engages in the research, design, development, manufacturing, leasing, sale, and servicing of tunnel boring machines, rail transit equipment, and specialized equipment in China and internationally. The company offers tunnel boring machines, drilling and blasting construction equipment, rail track and transit systems, agricultural machines, green building materials construction equipment, new construction materials, and mine construction equipment. China Railway Construction Heavy Industry Corporation Limited was founded in 2006 and is headquartered in Changsha, China. The company operates as a subsidiary of China Railway Construction Corporation Limited.

Company Details

  • SectorIndustrials
  • IndustrySpecialty Industrial Machinery
  • CEOMr. Yongjun He
  • Employees4.31K
  • HeadquartersNo.88, Dongqi Road, Changsha, China, 410100, China
  • Websitehttps://www.crchi.com

Leadership

  • Mr. Yongjun HeGM & Director · b. 1967
  • Mr. Pei Rong ChenChief Accountant & General Legal Counsel · b. 1970
  • Mr. Jian Li LuoDeputy GM & Chief Engineer · b. 1974
  • Mr. Gang LiSecretary · b. 1978
  • Mr. Wenzhong GongSpecial Researcher · b. 1970
  • Mr. Shaobao LiuDeputy General Manager · b. 1970
  • Mr. Guang Yong TanDeputy General Manager · b. 1972

Financials

Income Statement

Currency: CNY2017-12-312018-12-312019-12-312020-12-312021-12-312022-12-312023-12-312024-12-312025-12-31
Total Revenue6.65B7.93B7.28B7.61B9.52B10.10B10.03B10.05B10.05B
Growth (%)-+19.24%-8.19%+4.52%+25.05%+6.14%-0.73%+0.19%-0.01%
Cost of Revenue4.41B5.14B4.87B5.01B6.44B6.66B6.89B6.99B7.12B
Gross Profit2.24B2.79B2.41B2.60B3.08B3.44B3.14B3.06B2.92B
Gross Margin33.68%35.16%33.13%34.21%32.34%34.05%31.29%30.43%29.08%
Operating Expense906.75M899.84M698.94M833.33M1.15B1.42B1.39B1.40B1.25B
Operating Income1.33B1.89B1.71B1.77B1.92B2.02B1.75B1.65B1.67B
Operating Margin20.05%23.82%23.54%23.27%20.23%19.97%17.40%16.46%16.59%
EBITDA1.50B2.04B2.00B2.18B2.60B2.78B2.64B2.61B2.55B
EBITDA Margin22.49%25.71%27.52%28.67%27.37%27.51%26.34%26.03%25.36%
Net Income1.14B1.61B1.53B1.57B1.74B1.84B1.59B1.51B1.48B
Net Income Margin17.10%20.26%21.01%20.59%18.24%18.26%15.89%15.01%14.76%
R&D407.35M411.21M468.11M552.95M677.54M928.42M881.09M913.51M801.71M
R&D as % of Total Revenue6.12%5.18%6.43%7.27%7.12%9.19%8.79%9.09%7.98%
Interest Expense13.89M15.26M23.51M60.39M94.20M68.35M80.14M74.25M41.37M
Interest Expense % of Total Revenue0.21%0.19%0.32%0.79%0.99%0.68%0.80%0.74%0.41%

Balance Sheet

Currency: CNY2017-12-312018-12-312019-12-312020-12-312021-12-312022-12-312023-12-312024-12-312025-12-31
Total Assets15.34B16.04B15.16B17.06B22.67B23.79B25.44B26.71B27.30B
Total Liabilities7.48B6.73B8.01B8.76B8.47B8.28B8.89B9.13B8.69B
Total Equity7.86B9.30B7.13B8.28B14.17B15.49B16.53B17.56B18.59B
Cash2.20B3.16B2.37B1.33B2.61B2.15B1.09B2.33B2.38B
Total Debt503.21M203.69M967.40M2.19B1.32B1.27B1.76B1.50B1.28B
Net Debt-1.70B-2.96B-1.40B859.64M-1.28B-883.45M669.48M-828.78M-1.10B

Cash Flow

Currency: CNY2017-12-312018-12-312019-12-312020-12-312021-12-312022-12-312023-12-312024-12-312025-12-31
Operating Cash Flow386.83M1.99B1.75B-334.84M-1.48B1.07B703.53M2.04B1.10B
Investing Cash Flow-510.13M-382.44M-361.91M-343.26M-413.51M-892.97M-1.63B-279.49M-81.56M
Financing Cash Flow391.43M-404.52M-1.97B-250.10M3.19B-643.06M-183.44M-496.10M-970.05M
Capital Expenditure506.90M382.76M457.50M324.48M476.26M892.97M1.63B273.25M82.92M
Free Cash Flow-120.07M1.61B1.29B-659.32M-1.96B177.75M-926.48M1.77B1.02B
Dividends Paid113.11M123.52M2.72B1.46B86.06M522.68M554.68M539.35M485.14M
FCF to OCF-31.04%80.76%73.89%196.90%132.09%16.60%-131.69%86.64%92.47%
Dividend Paid to FCF-94.20%7.69%209.75%-220.99%-4.39%294.06%-59.87%30.45%47.66%

Earnings

Report DateSep 30, 2021Mar 31, 2022Apr 30, 2022Aug 31, 2022Oct 28, 2022Feb 27, 2023Apr 28, 2023
EPS Estimate-------
EPS Actual0.070.080.070.120.070.080.08
Surprise-------
Timing-Pre-marketAfter-hoursPre-marketAfter-hoursAfter-hoursPre-market

Key Statistics & Ratios

Market Cap21.07B
Enterprise Value20.44B
Trailing P/E17.17
Forward P/E0.00
Price / Sales2.22
Price / Book1.13
EPS0.23
Book Value3.50
Revenue (TTM)9.48B
Gross Profit (TTM)2.65B
EBITDA1.97B
Profit Margin13.21%
Operating Margin9.42%
Return on Equity6.86%
Return on Assets2.64%
Shares Outstanding5.33B
Shares Float1.42B
Beta0.17
Dividend Yield2.13%
Dividend Rate0.08
Payout Ratio36.96%

Dividends

20261×
0.08Aug 7, 2026
20251×
0.09Aug 7, 2025
20241×
0.09Aug 8, 2024
20231×
0.10Aug 8, 2023
20221×
0.10Jun 10, 2022